User Tools
Sidebar
Table of Contents
Generic User guide for SAP Cockpit. This Guide explains rules, data flows, configuration rules and menu used on the Out Of the Box version of Agentil SAP Cockpit.
Portal Menu Items
Home Page
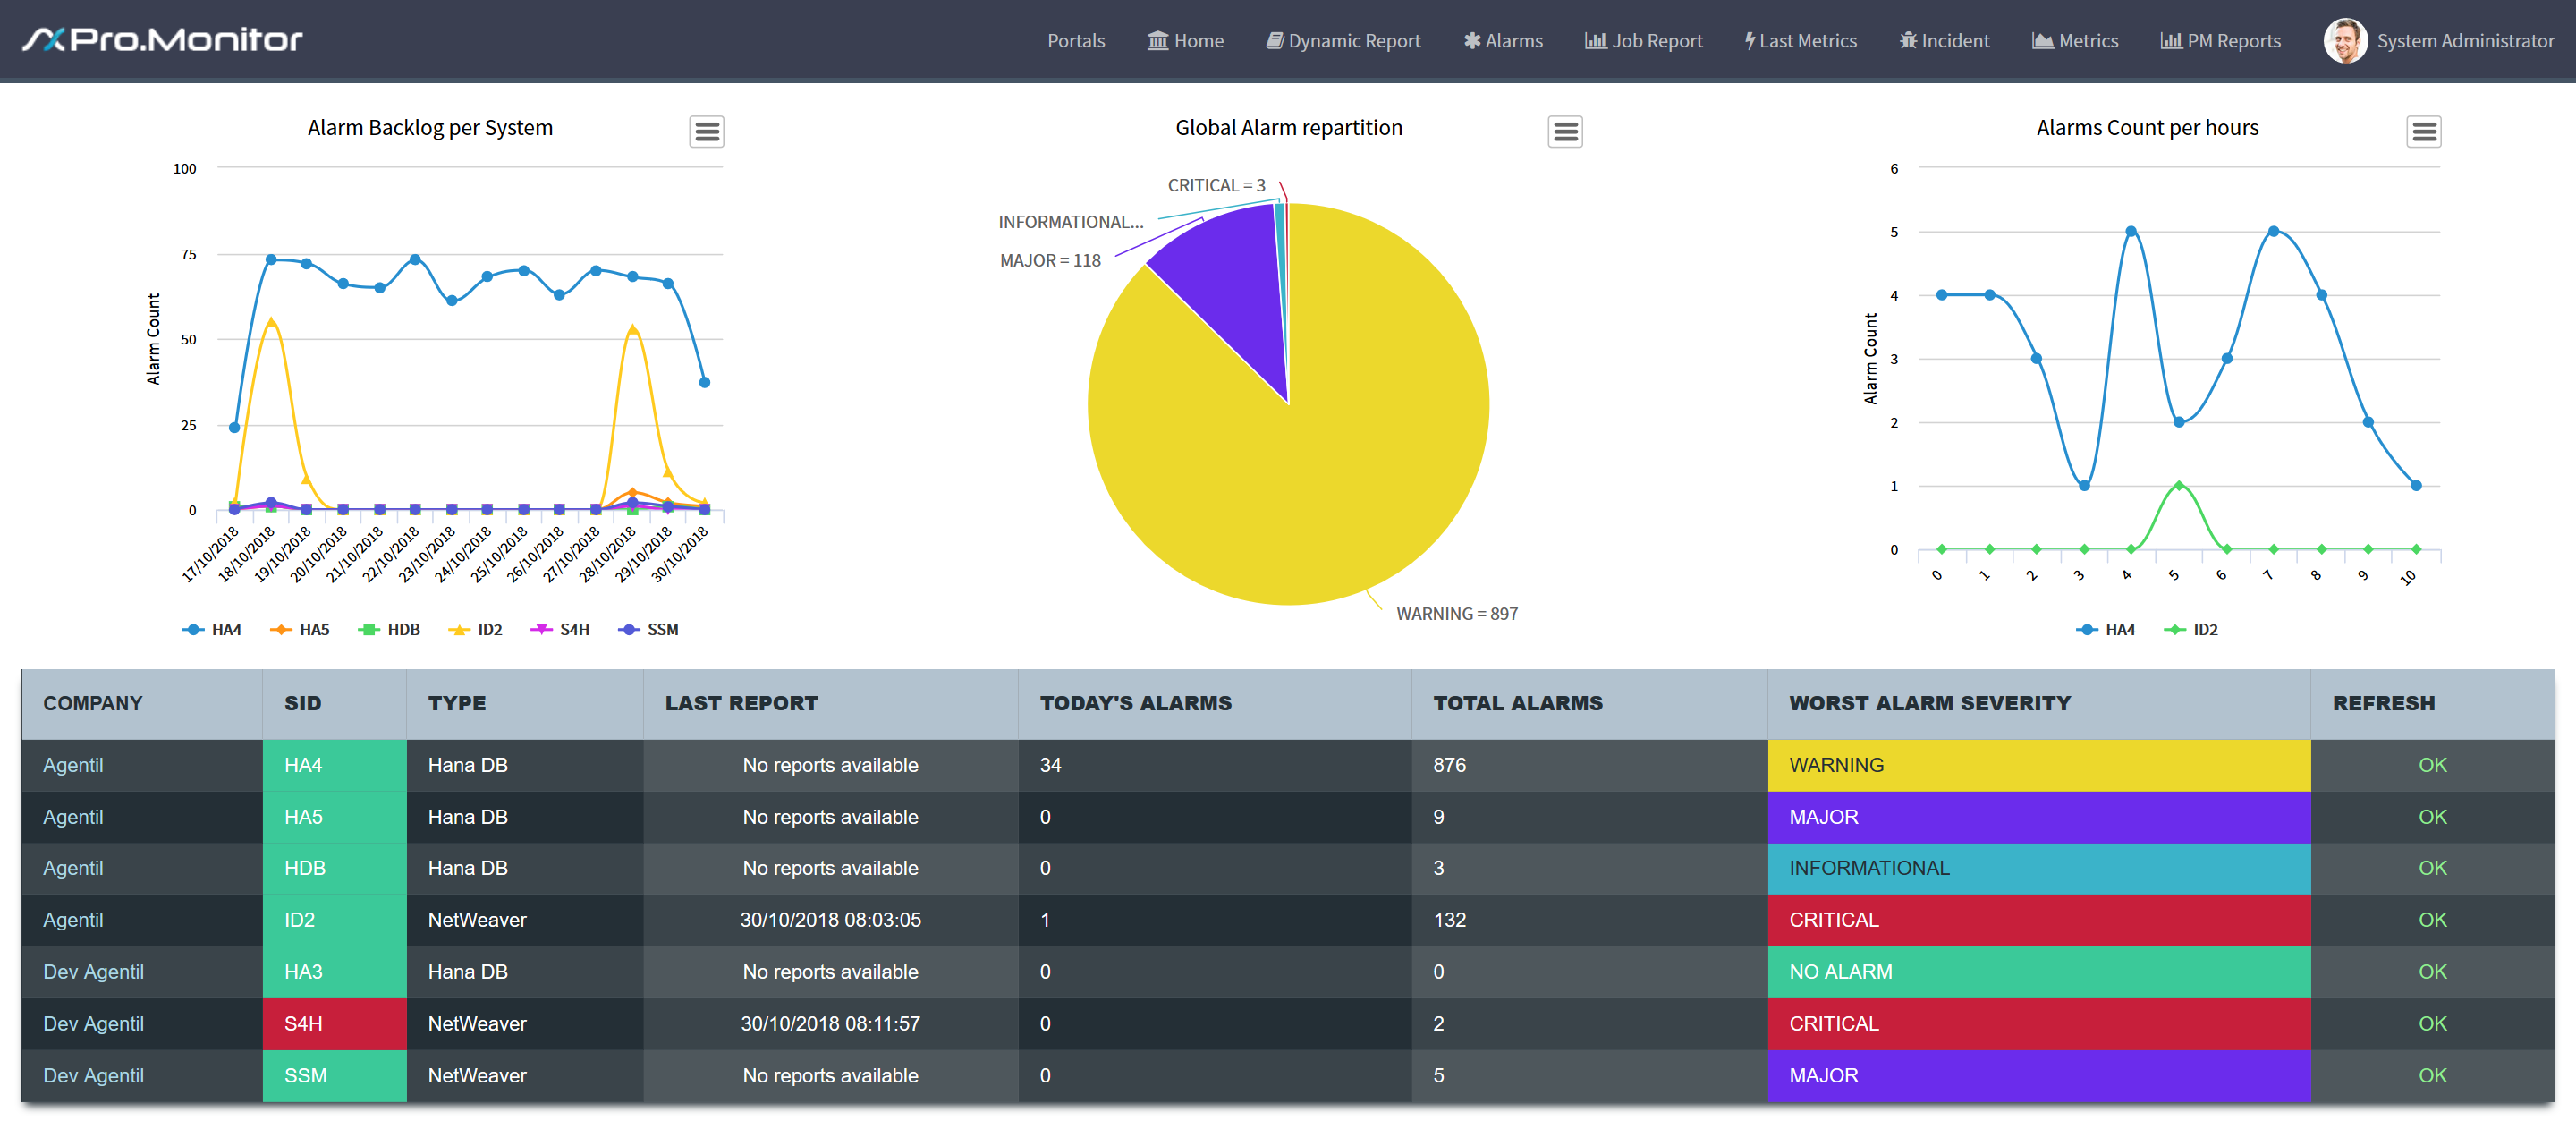
The main screen is divide in two parts, containing different information
- First part, System Reports. On the top of the page, there is three reports showing stats regarding alarms on the overall monitored system
- Second part, a table summarize information per systems
- Company
- Companies defined in Pro.Monitor
- SID
- System SID, the three letters identifying systems in SAP. Clicking on the SID will open a specific view of the system, depending on the type
- Type
- Type of system being monitored, could be Hana or Netweaver
- Last Report
- Date and Time of the last report received
- Today's Alarms
- Number of alarms received Today
- Total Alarm
- Total number of alarm currently active in the system
- Alarm Worst Severity
- Worst severity alarm detected on the system
- Refresh
- Shows OK when data are received from Promonitor. If the connection is lost during more than 5 minutes, and error alarm is automatically received
System Detail view
Alarm Repartition per System
The first big rectangle (could be green or red) shows the global system availability. It reflects the “system Availability” Pro.Monitor’s metric
The second part displays the alarm repartition for a given NetWeaver system, sorted by Module. The pie diagram is drawing the severity repartition
Database Info, JAVA and ABAP Connectors
The two tables show database Information related to Backup and figures associated with ABAP or JAVA instance Based on the Pro.Monitor metric “Database backups” and “Database size”, the Database table gives DATA and LOG filesystem usage in percentage
JAVA table displays JAVA stack availability and the different process status
ABAP table gives memory usage and status of the Stack
Alarms table
This shows the alarms list, sorted by severity. An action button is available to acknowledge directly the alarm This list cannot contain more than 100 alarms.
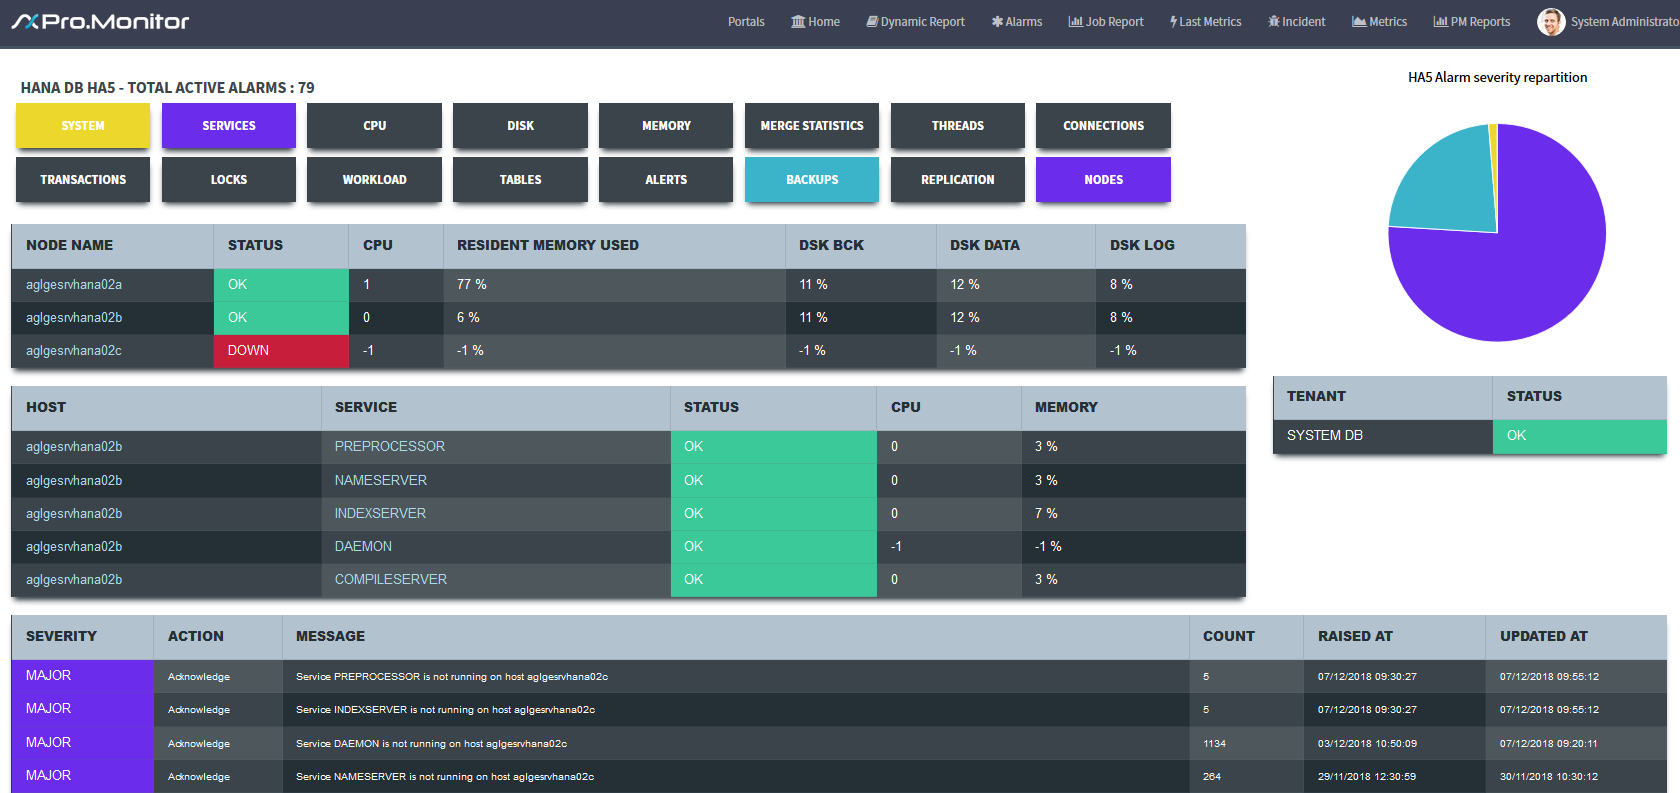
Hana View
Alarm repartition per modules
 It shows the alarm repartition per module for a given HANA system.
The pie diagram is drawing the severity repartition
Nodes table
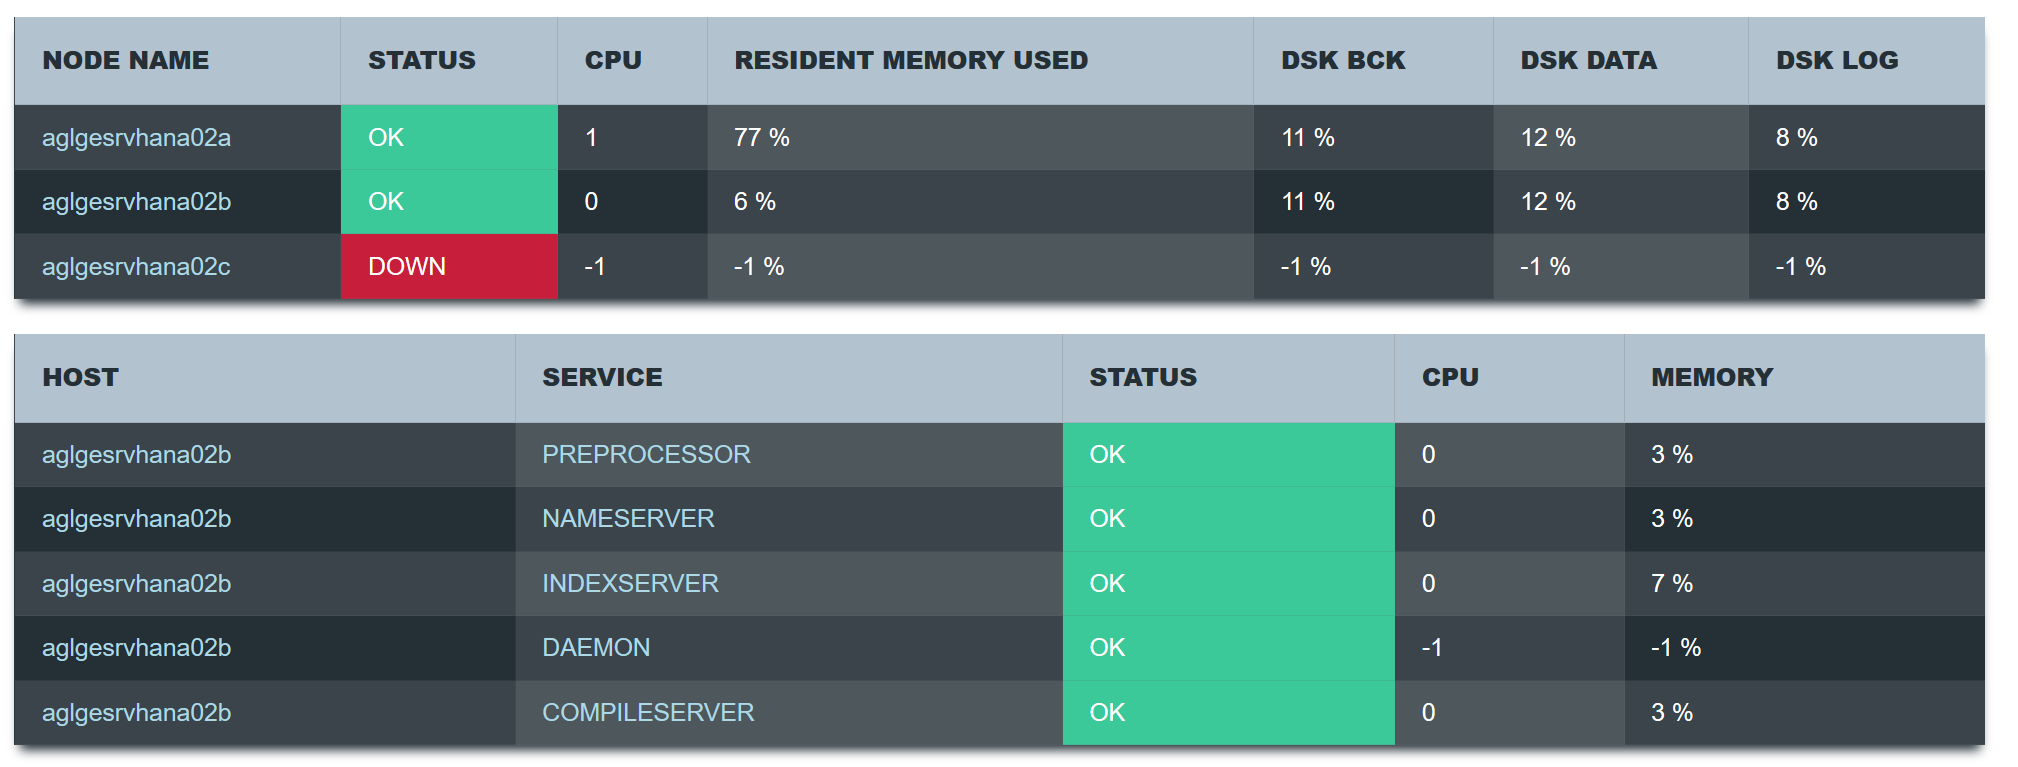
The two table on the upper left shows information on Systems and Services.
Node Information:
- Node Name : based on System configuration, the node host name. When clicked, the Service table below changes to the corresponding host
- Status : based on HANA_NODE_AVAILABILITY metric, display a Green OK or a RED Down when all availability metrics of the node are false (last metric table)
- CPU : based on DB_CPU_UTILIZATION metric, shows the CPU average value of the node
- Rmem Total used : based on DB_MEMORY_PERCENTAGEUSED_TOTAL_RESIDENT_MEMORY metric, shows the Resident Memory average value of the node
- Dsk BCK : based on DISK_DATA_BACKUP_PERCENTAGE_USED metric, shows the Data Backup disk usage percentage
- Dsk Data : based on DISK_DATA_PERCENTAGE_USED metric, shows the Data disk usage percentage
- Dsk Log : based on DISK_LOG_PERCENTAGE_USED metric, shows the Log disk usage percentage
Service target:
- Host : Name of the host running the service
- Service : Name of HANA service
- Status : based on SERVICE_STATUS metric, display a Green OK or a RED Down when all availability metrics of the node target are false (last metric table)
- CPU : based on DB_CPU_UTILIZATION_PER_SERVICE metric, shows the CPU average value of the node target
- Memory : based on MEMORY_PERCENTAGEUSED_PER_SERVICE metric, shows the Memory average value of the node target
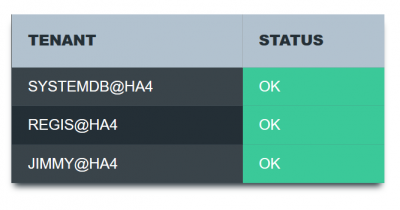
HANA Availabilty, TENANT availability
This table shows the HANA system availability. If there is multiple Tenant, they are listed and an indicator show the status. It could be Green or Red
Alarms table
This shows the alarms list, sorted by severity. An action button is available to acknowledge directly the alarm
Dynamic Reports
Job Reports
To be able to see the job report summary, user must add a specific line in the configuration file.
Example : In ProMonitor, open “SAP job monitoring” on an ABAP Monitor. Launch a test and look at the result screen
Please note the “TARGET” column, it will exactly be the name used in ServiceNow configuration file. Let's take “SWWERRE (800)”, so copy the character string with spaces.
- Open the config table (x_agsa_sapcockpit_config) in ServiceNow
- Click on New, add JobName (as read in ProMonitor), System (Mandatory), and set type as “job”
Now, on a daily basis and on a weekly basis, the job will be automatically added in the Job Report Summary. URL of the Summary page is https://<SNOW INSTANCE>/sapcockpit?id=jobreport
Those two tables shows a report based on job execution time. The first number in cell is the avrage job execution duration in ms, the second is the standard deviation and the third number is the number of measure used for calculation.
Clicking on the Jobs name redirect the user to the report table where data are stored. In this view, the user can consult metrics used for calculation
The first table shows a daily job report, and the second one shows weekly statistics
Alarms
Alarm List
The Alarm list button shows the list of alarms, currently not acknowledged. When an alarm is acknowledged, it disappears from this view but still exist in the system. If the same problem comes back, the same alarm will be raised again, the acknowledge field will be set to false.
Alarm Form
When clicking on an alarm, user go to form view. In this view, an alarm could be acknowledged or “snoozed”
This means that the alarm will be acknowledged during a period defined by the user.
Acknowledgment set a field on the alarm called “Locked until” and set the acknowledgment field to “true”. After this time, the alarm come back in not acknowledged mode
Last Metric
This table is used to register each metrics coming in Service-Now from Pro Monitor, and store the last value. Metrics here aren't deleted by any process, but a update count grater than 1 or 2 days means that the metric is no more monitored by Pro Monitor
Metrics
The Metric table contains all the “bulk” metrics coming from Pro Monitor. A table rotation has been setup on Service-Now side to avoid having millions of metrics here. This table is used to created curves and dashboards on the Portal
PM Reports
ProMonitor is able to send reports to ServiceNow with email. Such Reports are stored in a table. This page displays the two widgets, on the right the reports received today, and on the left the reports received in the past.
Choosing a report will open the report page, simply click on the attachment to open it
UI16
- PortalView : Access to Portal
- PM Reports : REPORTS generated by ProMonitor for a system
- Today’s Alarms : List all alarms raised today
- All Alarms : List all alarms
- All Metrics : List all Metrics
- Last Metric Table : Last Value received of a Metric
- Daily Reports : JOB daily reports table
- Weekly Reports : JOBS weekly reports table
Admin Menu is available for user with admin role
- Config Table : Metric White list and Job report declaration
- Scheduled Jobs : Scheduled Jobs used for JOB report calculation
- WS Metrics : Web Service for inserting Metrics
- WS Alarms : Web Service for inserting Alarms
Configuration and Behavior
Data Coming in and Out
ProMonitor is able to send tons of metrics in Snow. To avoid serviceNow to be spammed by metrics, a configuration table contains (see UI16 menu) a list of metrics « authorized » to be pushed in ServiceNow. Adding metrics in this table will add a new metric in ServiceNow
The same table is used to add Jobs in the Job report module to be monitored
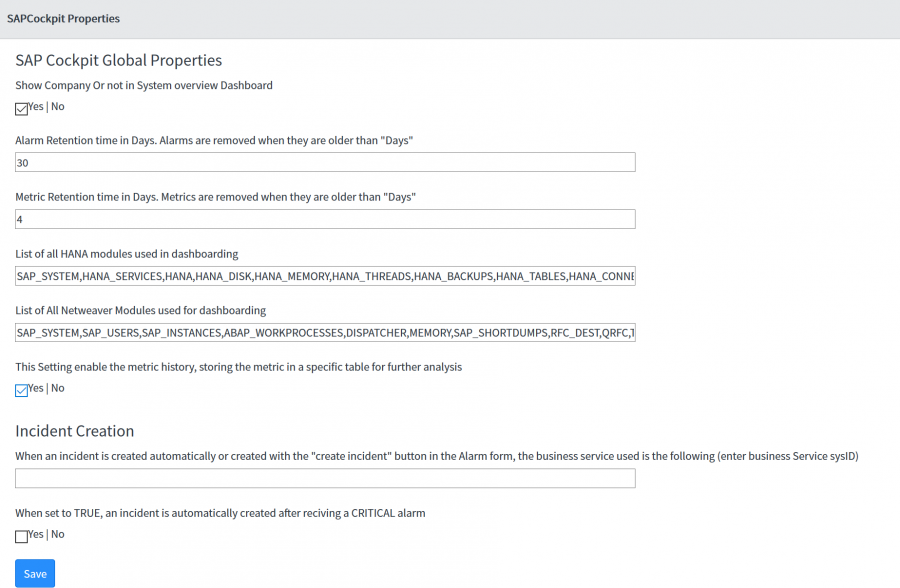
Properties page
Changing the different properties will change the Portal data output.
- Show Company or Not in System Overview Dashboard
- Setting this to true will create or remove the first column “company” in the system overview dashboard
Alarm and Metric retention time in Days. Items are removed when they are older than “Days”

- The two fields “List of ….” in property page gives the name of the modules displayed in the dynamic report
- Metric History
- When set to true, all metrics are stored in the x_agsa_sapcockpit_metric table. This setting is mandatory for the JOB report system
- Incident Creation
- When set to true, an incident is automatically created on the system after receiving a critical alert
- The business Service used in the incident freshly created is the one entered in the field (enter the sysid)


